
Though it may not sound obvious, it is possible to debug an Annotation Processor, put a break point and look precisely at what is going on.
This article will dive into the details on how I currently debug the Annotation Processor of DAMapping.
The Javac compiler internally uses a JVM to do its work. So, the basic idea is to find a way to configure this JVM to accept a debugger connection and to be able to attach to the compiler process before the Annotation Processor is run.
Since the DAMapping project is build with Maven, my debug technic of choice is to use the mvnDebug command.
mvnDebug
mvnDebug is a command that lies in the same directory as the mvn command. So, as long as the bin directory of your Maven installation is in the path, you should be able to use it seamlessly.
mvnDebug is the same exact command as mvn except that it will stop instantly after beeing run and wait for a debugger to attach to its Java process before proceeding.
As the Javac command run by the maven-compile plugin lies in the same process as the mvn command, attaching to the mvn process allows to attach to the javac process.
Set up a debug connection in IDEA
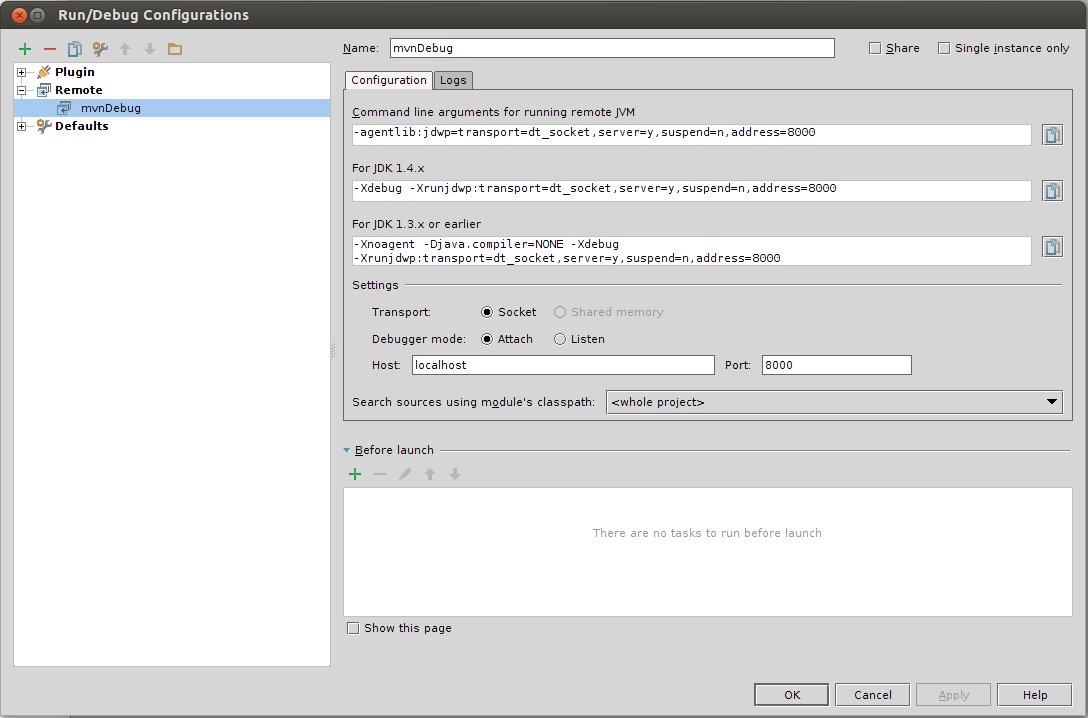
Since I use IntelliJ IDEA, here is how to set yp a debug connection to attach to the mvnDebug process in IDEA:
- go ro
Run>Edit configuration...(or use the first item in the run/debug combo) - click on the green
+sign and selectRemote - name to the new configuration, for example to “mvnDebug”
- change port to
8000and leave any other field to its suggested value- host should be
localhost, TransportSocketand Debugger modeAttach
- host should be
Debugging
Go to a terminal and run a command such as the following:
mvnDebug clean installit is best to always use the
cleanphase to make sure all files are compiled when debugging. Also, the command must include the compile phase otherwise the Annotation Processor will never be run
Go to IntelliJ IDEA, run the configuration you created.
It will create a debugger session that will attach to the process on port 8000 and the Maven process will resume (you can switch back to the terminal to see the logs moving).
Debuging Javac directly
This post explains how to debug an Annotation Procossor when running Javac directly.
The basic idea is the same as above: allowing to connect with a debugger to the underlying JVM used by the javac command.
This is achieved by the using the -J option of javac which role is to pass option to the underlying JVM.